
The ThinkorSwim (ToS) desktop platform, by Schwab (formerly TD Ameritrade), is extremely powerful. It can be used for executing trades, doing technical or fundamental analysis, analyzing portfolio risks, and a ton more.
For beginners, setting up ThinkorSwim can feel overwhelming due to the sheer number of toolbars and menus that are available.
In this article, we’ll focus on a smaller part of ToS functionality — setting up a useful layout. Starting with a useful layout will provide a foundation to adding more complex functionality and features down the road. Check out our full ThinkorSwim review >>>
Adding Watchlists
The layout we’ll create is chart-based. In other words, there will be several charts in the main area. The left pane will be filled with watchlists. It’s not a complex layout but will mostly provide what you need to get started with ToS.
I’ll be logged into a paper trading account. You can get a ToS paper trading account for free. Just sign up here. With paper trading, quotes are delayed by eight seconds and potentially longer for some instruments.
Setting up ThinkorSwim with live quotes will require you to fund an account with at least $500 (permanently) and complete the exchange agreements. After logging in, your ToS default layout may look like the following:
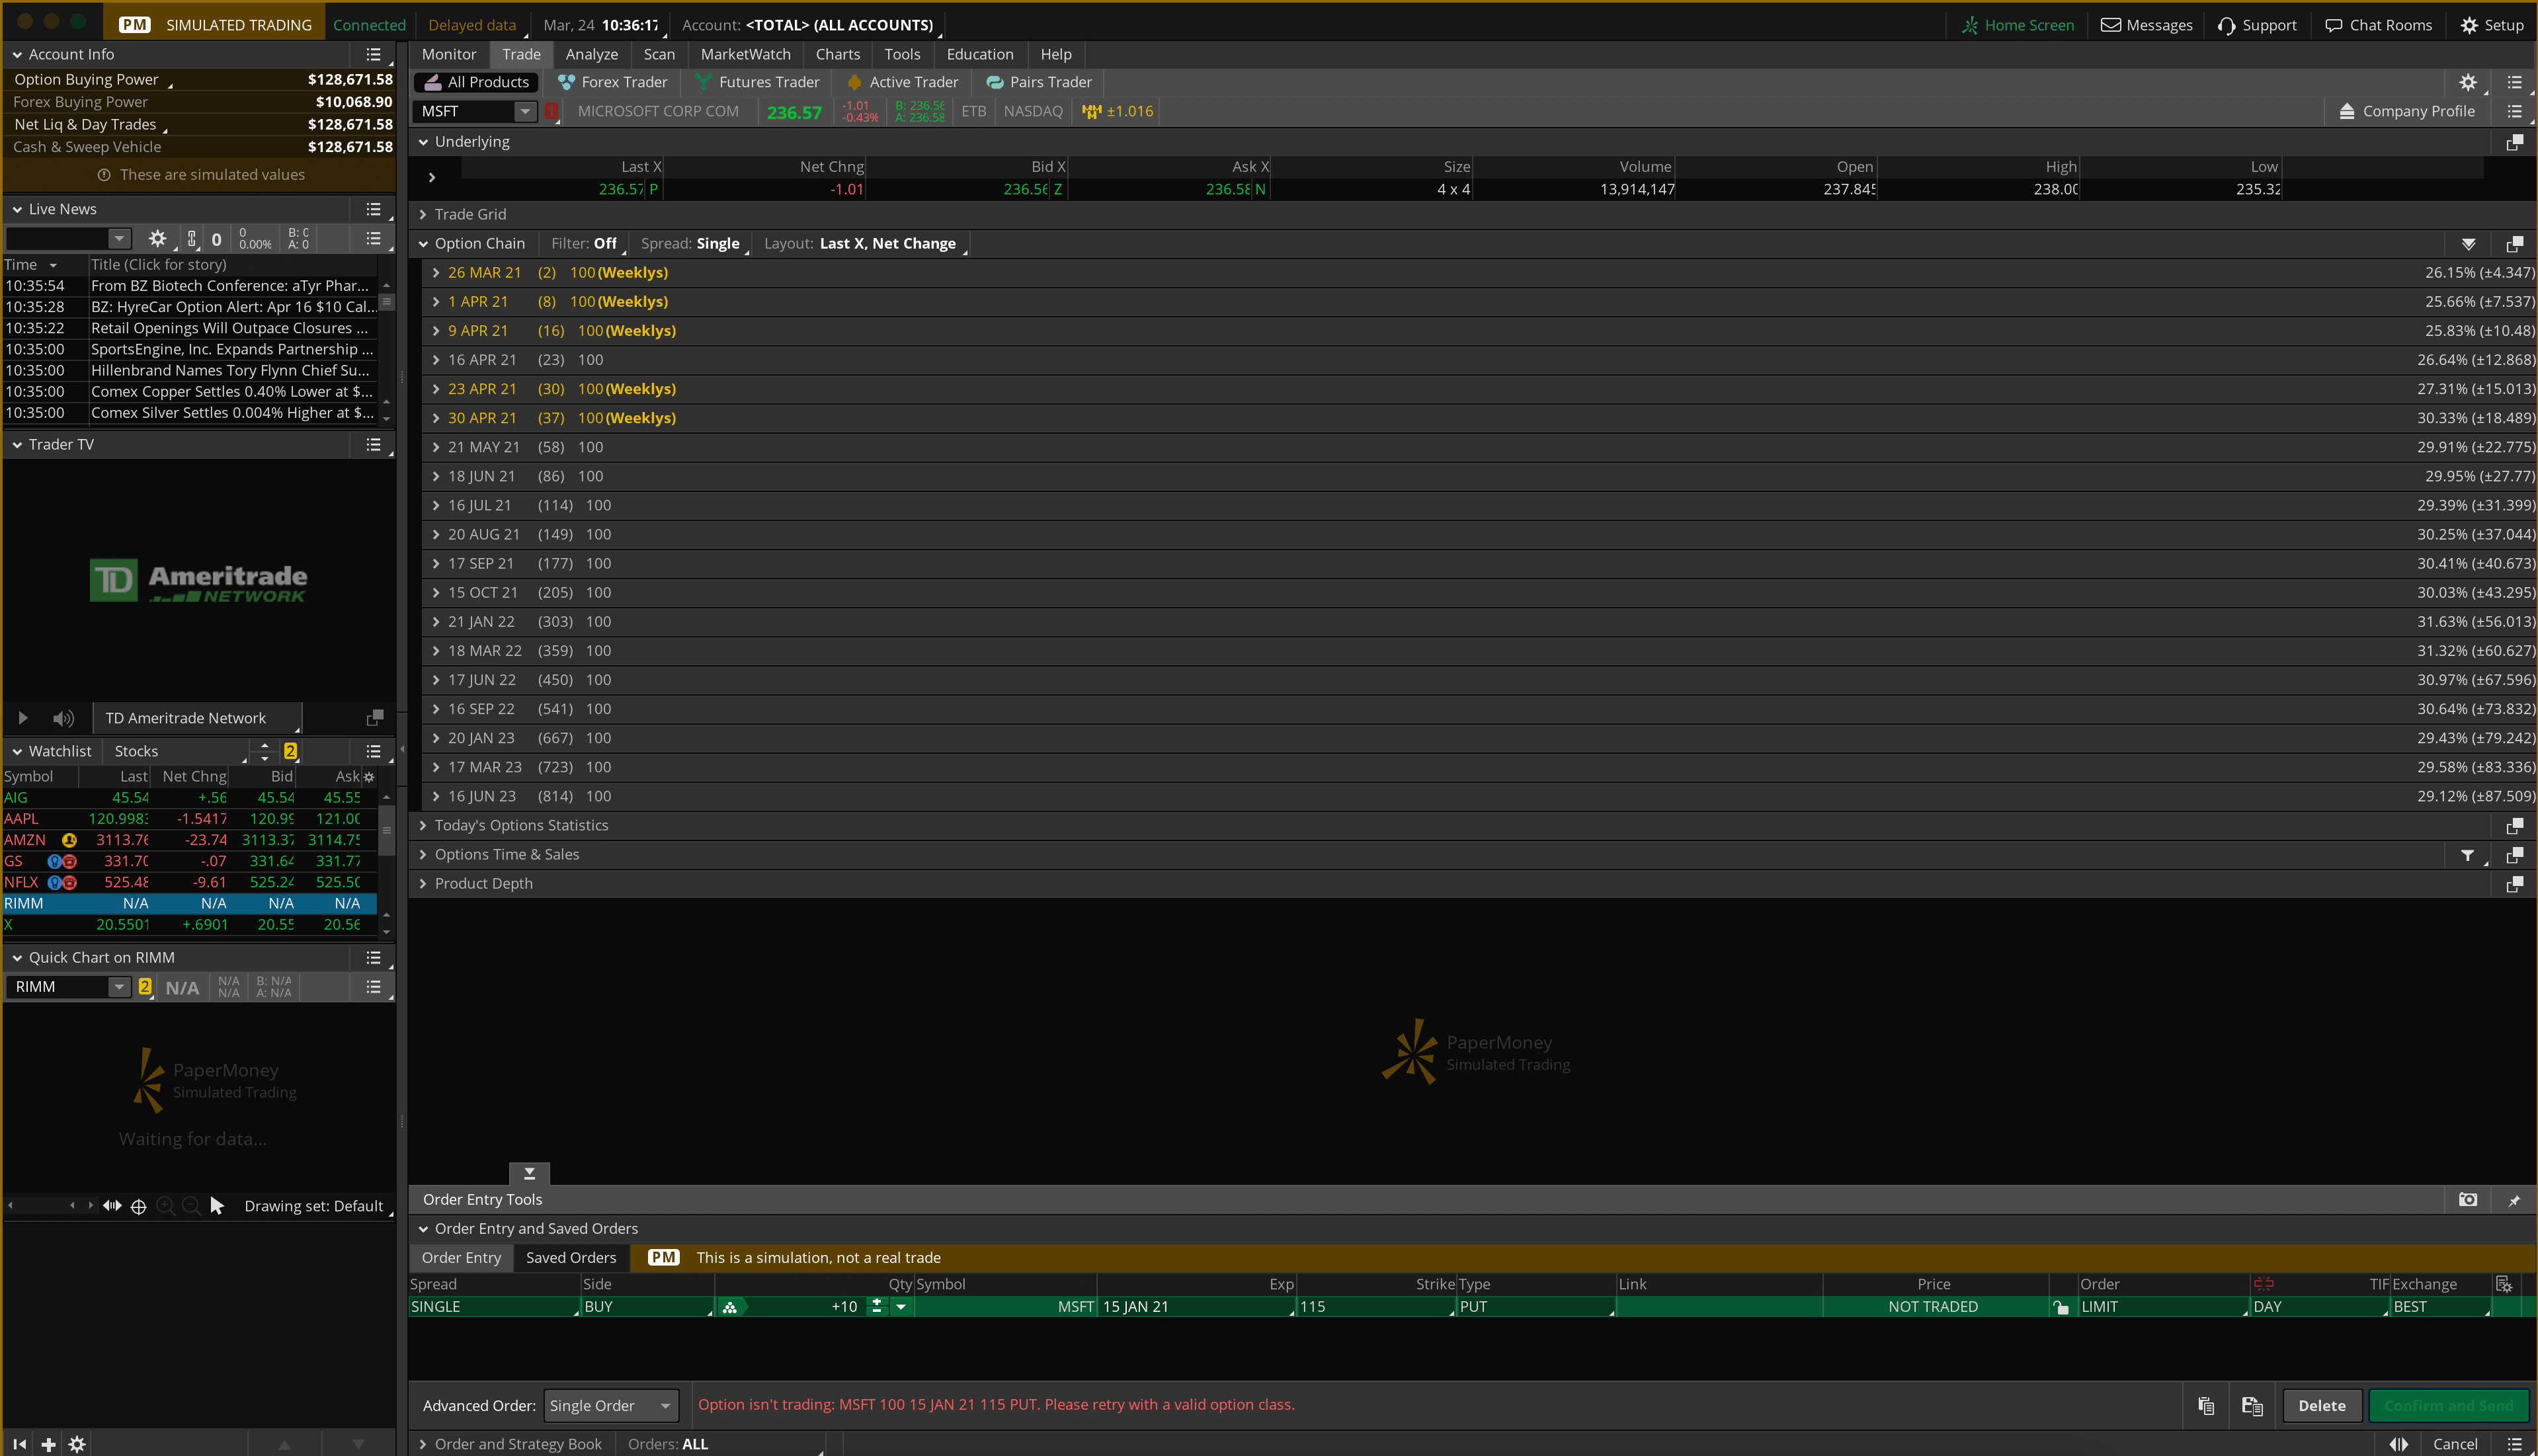
The layout has a left side pane and the main section, which is open to the Trade tab. Click on the Chart tab. We're going to add more watchlists to the left side pane. But first, let's remove all the existing gadgets in the left pane. To do that, click the three-line icon in the top right of each gadget, then select delete.

To add a new watchlist, click the “+” at the bottom left of the app and select Watchlist in the popup.
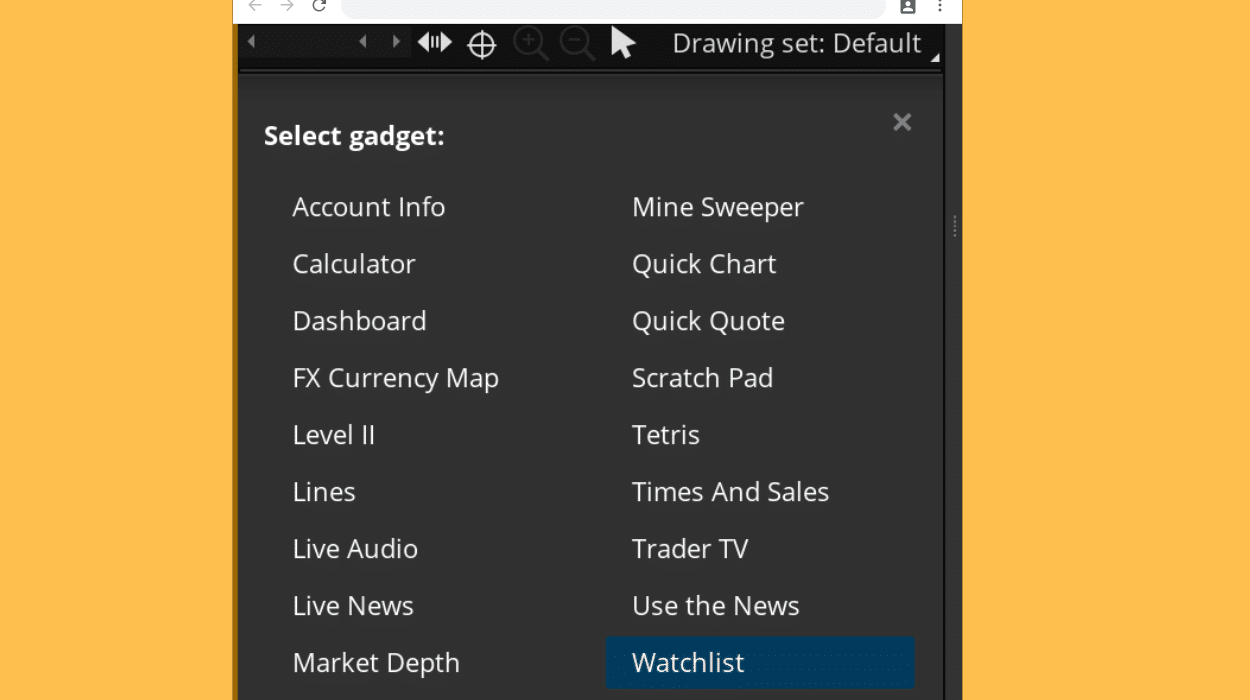
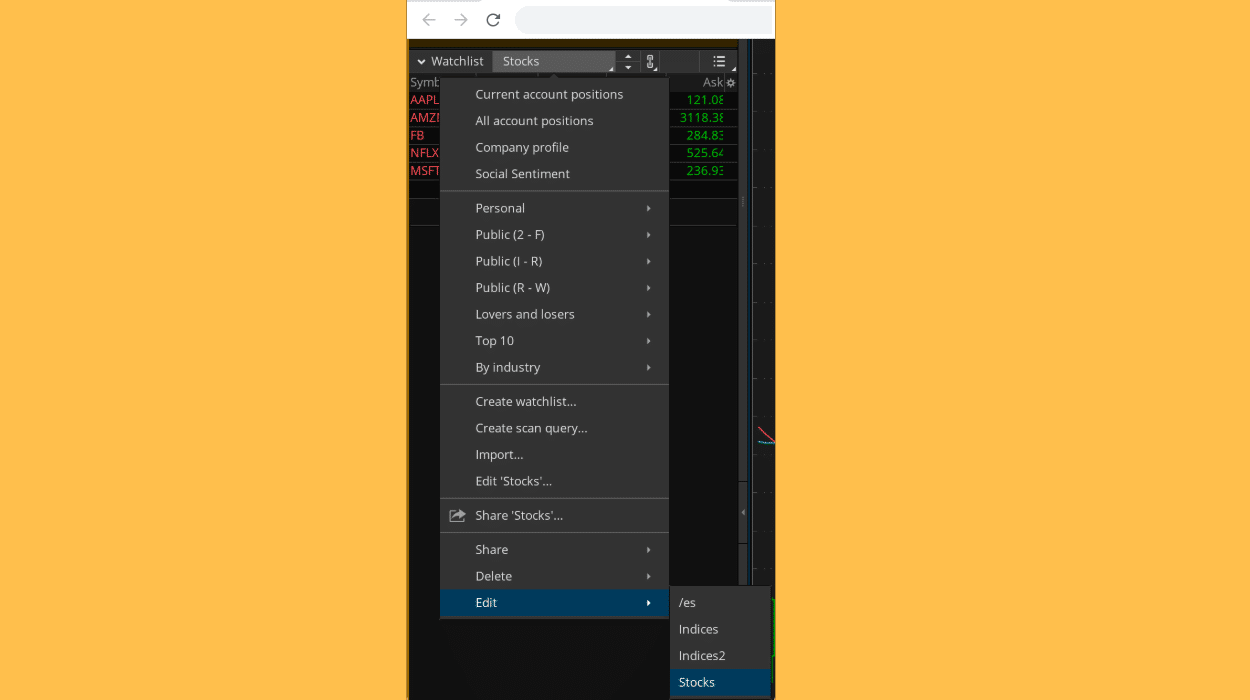
Give the new watchlist the name "Stocks." Then type in the symbol MSFT under the Symbol column. That adds the first stock to the watchlist. I’ve added a few more symbols that include the FANGs. If you want to edit the name of a watchlist, click the watchlist name, then edit and select the watchlist to edit.
To continue setting up ThinkorSwim, add another watchlist and call it BigCap. After the watchlist is created, add the following symbols:
- AMZN
- GOOG
- TSLA
- AAPL
Now there are two watchlists. As more symbols are added to a watchlist, a scrollbar will appear on the right side of the watchlist. You can click and drag the lower watchlist, giving the upper watchlist more room and removing the scrollbars in the process.
We’re going to now link the Stocks watchlist to the chart. Click the link icon to the right of the first watchlist and select 1. Do the same for the other watchlist and select 2. The chart also has a link icon to the right of the symbol field. Change it to 1.
Click MSFT in the Stocks watchlist and watch as it updates the chart with the symbol MSFT. If you click any symbol in the BigCap watchlist, the chart will not update because nothing else is linked to #2.
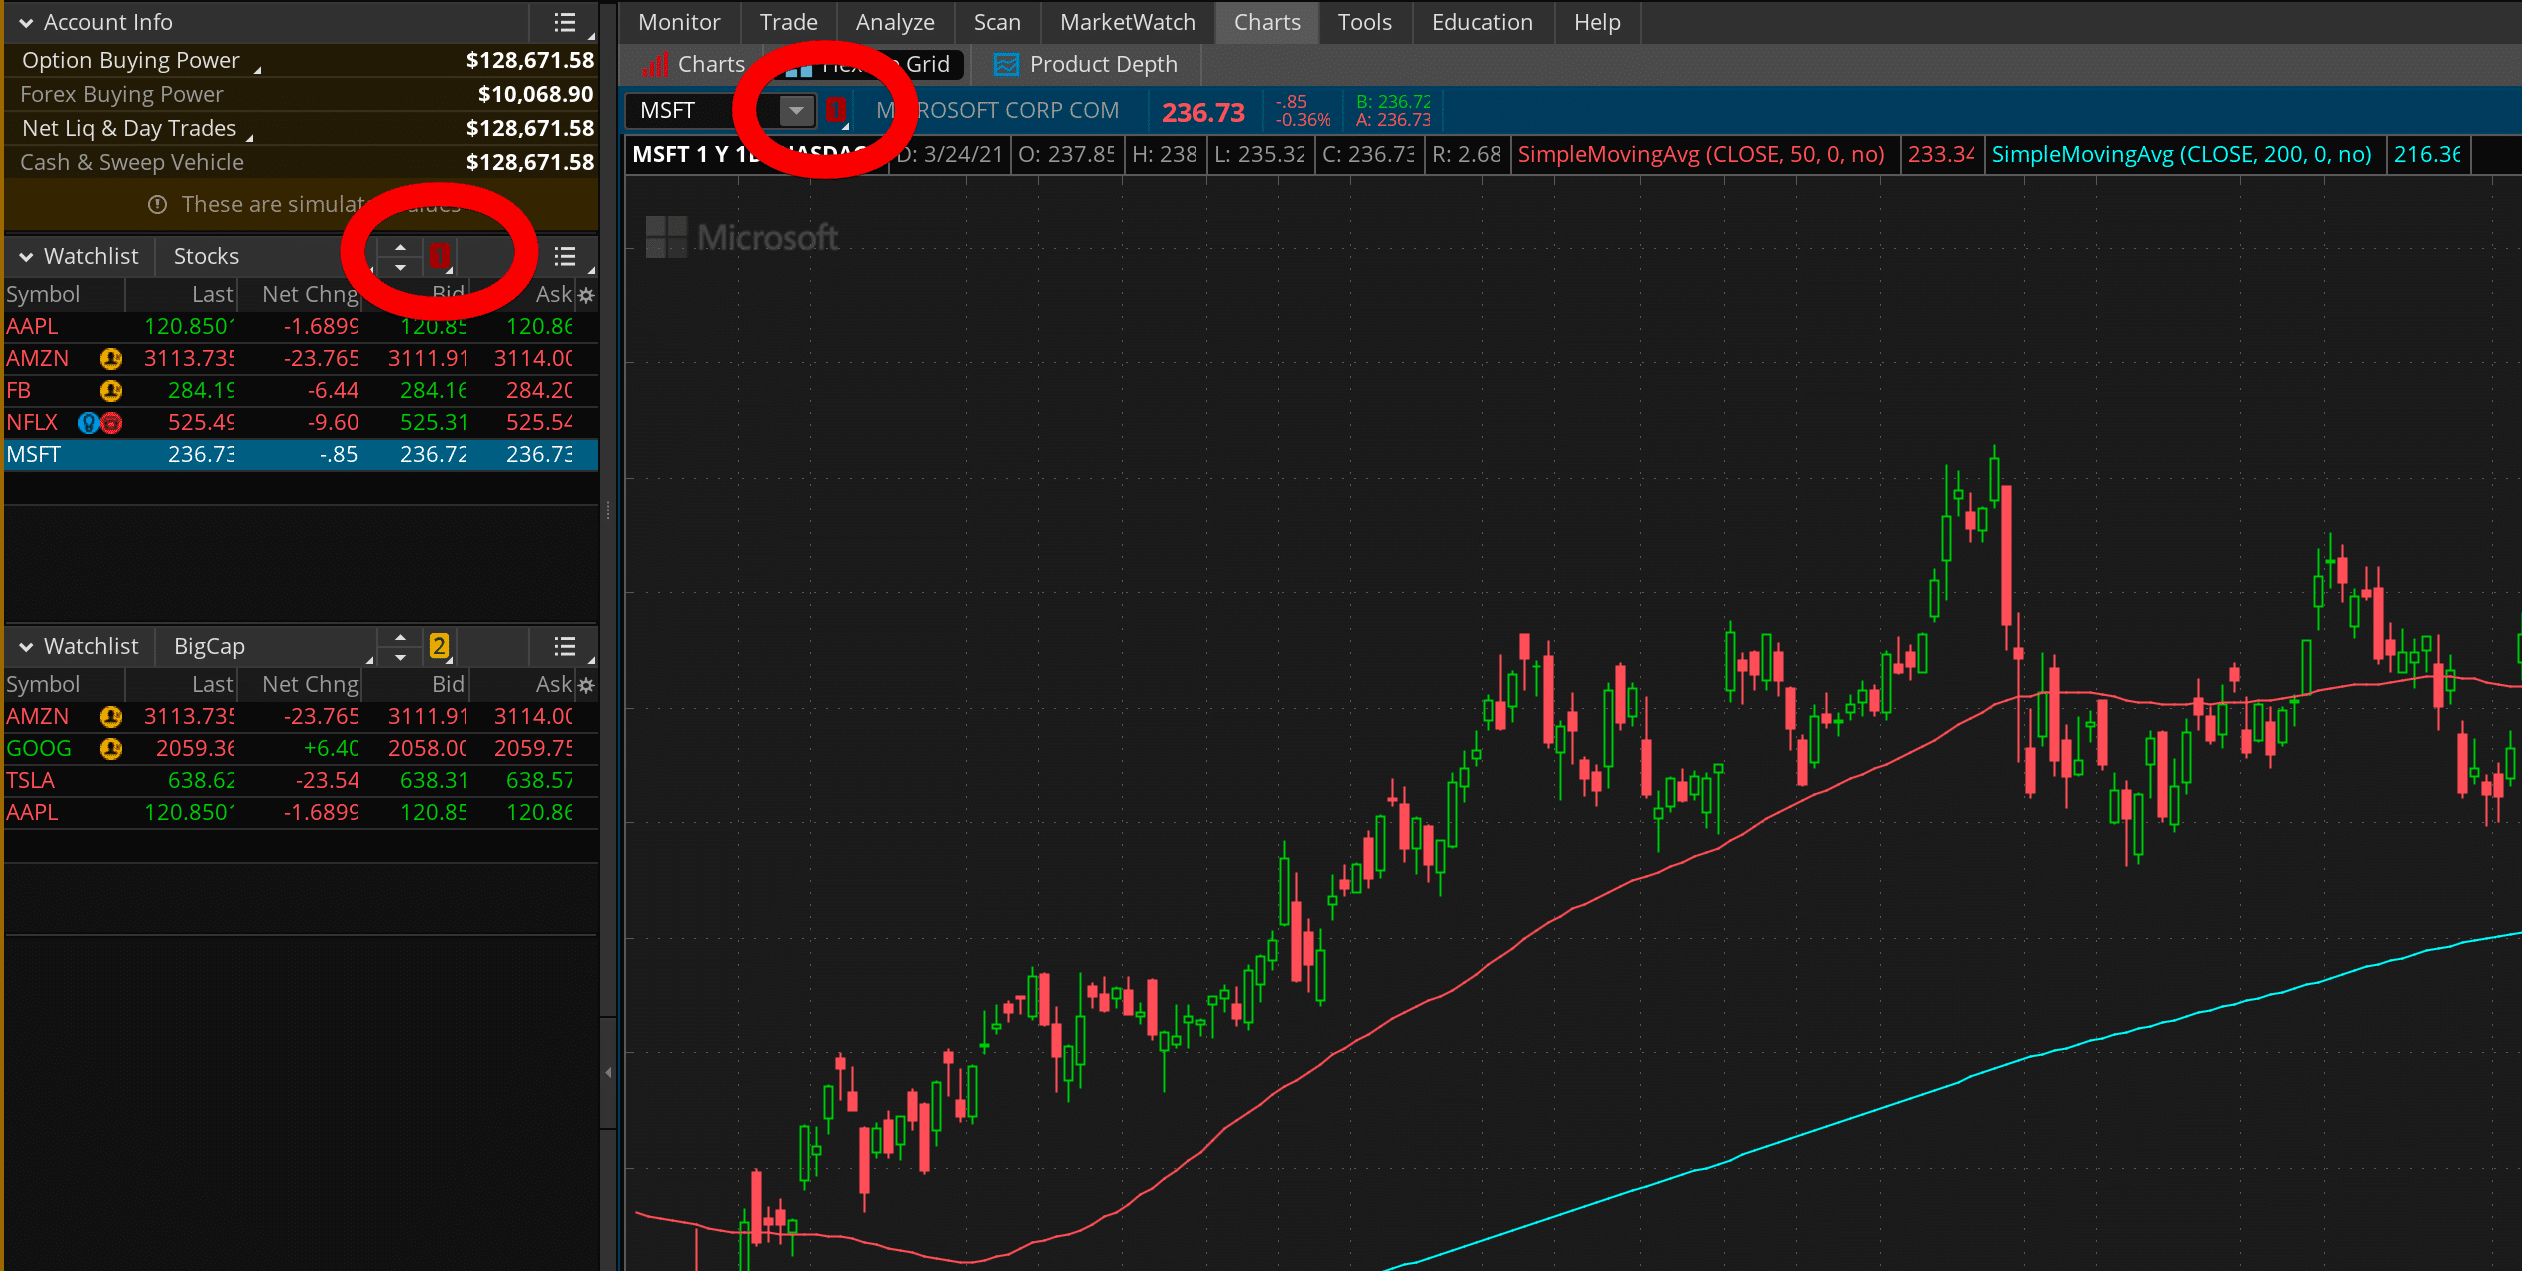
Next, we’ll add more charts and link to them as well.
Modifying The Chart Layout
There’s only one chart in the ThinkorSwim layout that we've built so far. To add another chart next to this one, click the 9-dot grid icon in the top right of the app under Setup. Then check Customize grid.
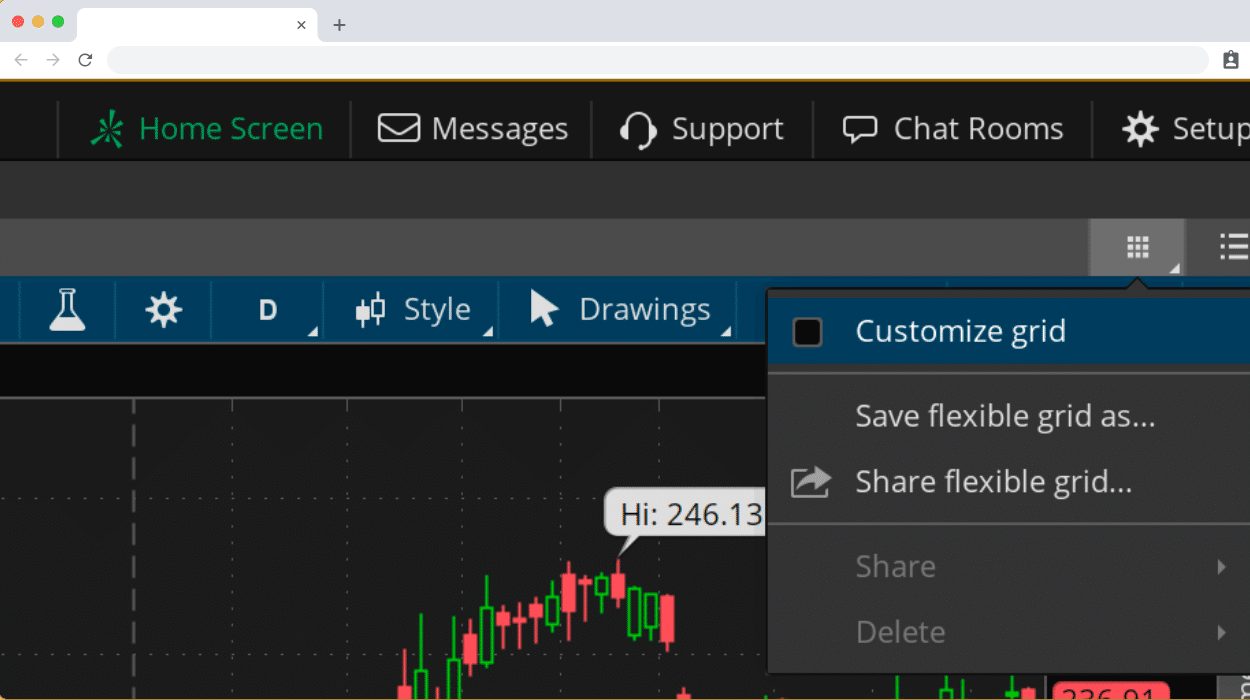
A box with three icons and the text Sidebar appears over the grid. Click the middle “+” icon to add a grid to the right. Go back to the 9-dot icon and un-check Customize grid.
In the second grid, click the link icon and select #2 (yellow). In the BigCap watchlist, click TSLA. It should populate the new grid.
You can add another row of grids under these two by going back to Customize grid and selecting the first icon on the Sidebar box. That will place another grid below the current two.
Adding Another Chart Time Frame
A lot of traders like to view a stock in multiple chart time frames so they can narrow in on a trade entry. We’ll do that now with the current two charts.
Change the second chart’s link to #1 (red). MSFT should fill the second chart. Click on the “D” (day) menu item at the top of the chart. Select the 5D:15m chart. The grid will update to the 5 day, 15 minute chart.

When you click any symbol in the Stocks watchlist, you’ll be able to view both the daily and 15 minute charts together. Also, you don’t have to stick with only the Stocks watchlist symbols. Type JPM into either chart and both will update with that symbol.
Final Thoughts
Certainly, this layout is only a small step towards setting up ThinkofSwim, but a very useful one. There’s plenty more to explore in how you can arrange charts and link different elements of the layout. If you want to explore more, ToS has a fantastic set of tutorials on Youtube. Open a Schwab account to get started with ThinkorSwim >>>

Robert Farrington is America’s Millennial Money Expert® and America’s Student Loan Debt Expert™, and the founder of The College Investor, a personal finance site dedicated to helping millennials escape student loan debt to start investing and building wealth for the future. You can learn more about him on the About Page or on his personal site RobertFarrington.com.
He regularly writes about investing, student loan debt, and general personal finance topics geared toward anyone wanting to earn more, get out of debt, and start building wealth for the future.
He has been quoted in major publications, including the New York Times, Wall Street Journal, Washington Post, ABC, NBC, Today, and more. He is also a regular contributor to Forbes.
Editor: Clint Proctor Reviewed by: Chris Muller
